
Boom Learning Reports help you answer the questions educators ask every day:
- Which students need additional support?
- Which students have mastered a skill?
- Is a student improving over time?
- What data can I use during parent conferences, interventions, or IEP meetings?
- How can I monitor student progress without adding more grading to my workload?
Whether you're a classroom teacher, special educator, or speech-language pathologist, Reports provide quick access to student performance data so you can make informed instructional decisions.
Reports can be found in 3 places: the Reports Tab, the Classes Tab and the Deck Reports.
Use the table of contents to jump to sections that matter to you!
TABLE OF CONTENTS
- Before You Begin: Key Terms
- What Can Reports Help Me Do?
- Navigating The Reports Tab
- Understanding Your Data
- Print and Export Reports from the Reports Tab
- Real-World Reporting Examples
- Accessing Reports From The Classes Tab
- Navigating Individual Student Report
Before You Begin: Key Terms
Understanding a few Boom Learning terms will help reports make much more sense.
|
Term |
Meaning |
|
Batch |
A group of cards delivered to a student during a play session. |
|
Set |
All cards contained in a deck. |
|
Plays |
How many deck sets have been completed. |
|
Gems |
Cards answered correctly at least once. |
|
Average |
Performance across recent completed sets. |
|
First |
Score from the first completed set. |
|
Last |
Score from the most recent completed set. |
|
Best |
Highest score from recent completed sets. |
Important: First, Last, Best, and Average are calculated using completed sets, not individual batches.
What Can Reports Help Me Do?
Classroom Teachers
Can use reports to:
- Identify students who need further help
- Create intervention groups
- Monitor independent work
- Reduce grading time with automatically collected performance data
- Track student growth over time
Special Education Teachers
Can use reports to:
- Monitor IEP-related progress
- Collect instructional data for student reviews
- Document intervention effectiveness
- Track independence and mastery
- Prepare for meetings without scrambling for data at the last minute
Speech-Language Pathologists
Can use reports to:
- Track articulation and language progress
- Monitor vocabulary and social-pragmatic skill development
- View performance trends over time
- Collect data during therapy without disrupting student engagement
- Reduce manual session documentation burdens
Navigating the Reports Tab
The Reports tab allows you to view, filter, print, and export student performance data.
Choose:
- A time frame
- A classroom
- One or more decks
Once selected, the report area automatically populates with student data.

Time Frame
The Time Frame menu lets you focus on a specific reporting period.
The number displayed next to each time frame represents the number of recorded plays during that period. This allows you to compare performance across time.

Use this when:
- Preparing for progress reports
- Reviewing recent intervention results
- Evaluating growth over a defined period
Classrooms
Select the classroom whose data you'd like to review. The reports update automatically to reflect the selected class.

Decks
Choose one or multiple assigned decks.
You can:
- Browse library folders
- View currently assigned decks
- Search directly for a deck by name
Viewing multiple decks together can help identify broader skill patterns across a classroom.
Report
Once you have selected your criteria, the main reports area will populate.

Filters and View Options
Use filters to:
- Search for specific students
- Sort by name
- Print reports
- Export data to CSV
These tools are especially useful when preparing documentation or reviewing a single student's progress.

Go Live: Real-Time Monitoring
Premium members can use Go Live to view student activity in real time.
This feature helps you:
- Monitor independent work
- Spot misconceptions while students are working
- Provide immediate reteaching
- Track student engagement during in-person or remote instruction
Which Metric Should I Use?
|
If you want to know... |
Look At |
|
Has the student completed the assignment? |
Plays / Progress |
|
Has the student mastered the skill? |
Gems |
|
What did they score most recently? |
Last |
|
Are they improving? |
First vs Last |
|
What is their overall performance? |
Average |
|
Which questions are difficult? |
Accuracy Report |
|
Which skills need reteaching? |
Deck Detail Report |
|
Are students becoming more fluent? |
Response Time |
Understanding Your Data
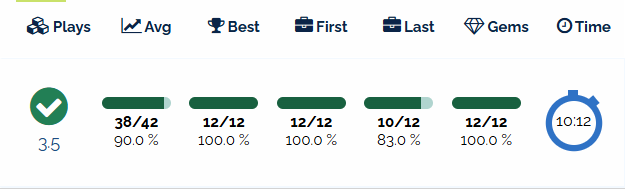
Plays
The Plays metric shows how much of a deck has been completed.
Because some decks are delivered in batches, a student may have partial plays displayed (such as 3.5 plays). This indicates they have completed part of another set but not the entire deck.
What Should I Look For?
✅ Students steadily progressing toward completion
✅ Completed sets available for trend analysis
⚠️ Many incomplete plays may indicate students are not finishing assignments
How Can I Use This Data?
- Monitor assignment completion
- Determine when enough data exists for analysis
- Verify participation levels before reporting progress
Gems
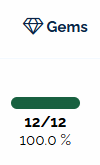
Gems represent the number of cards answered correctly at least once.
The goal is for the first number to match the total possible number of gems available in the deck.
What Should I Look For?
✅ Gems increasing over multiple plays
✅ High gem counts combined with strong Last Scores
⚠️ Low gem counts despite multiple attempts
How Can I Use This Data?
- Monitor mastery
- Identify skills requiring reteaching
- Document student growth
- Track intervention effectiveness
Time
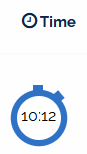
Time displays the total amount of time spent working through deck content.
What Should I Look For?
✅ Increasing accuracy with stable completion times
✅ Faster performance combined with high accuracy
⚠️ Very long completion times may indicate difficulty
How Can I Use This Data?
- Evaluate fluency
- Adjust difficulty levels
- Identify assignments that may be too challenging or too easy
Average (Avg)
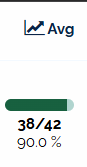
Average reflects performance across recent completed sets.
What Should I Look For?
✅ Consistently high average scores
✅ Gradual improvement over time
⚠️ Large drops in average performance
How Can I Use This Data?
- Create intervention groups
- Compare overall performance across students
- Identify students who may need additional support or enrichment
First, Last, and Best Scores
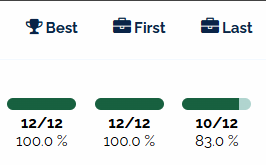
First
The student's score during their first completed set.
Last
The student's most recent completed set.
Best
The highest score among recent completed sets.
What Should I Look For?
✅ Last score higher than First score
✅ Best score continuing to improve
✅ Consistent progress across play sessions
⚠️ Little or no improvement after repeated attempts
Example
|
Metric |
Score |
|
First |
40% |
|
Last |
85% |
|
Best |
90% |
|
Gems |
18/20 |
This pattern suggests meaningful growth and increasing mastery of the targeted skill.
Print and Export Reports from the Reports Tab
You can print and export reports from the Reports tab The Export button will create a downloadable CSV file (for Excel) with the data organized by the deck and student.
Select the classroom and decks that you would like to view data from. Then, click the Export button.

You will be prompted to choose a destination for the file on your device. Once you have saved the file, you can open it in Excel. The data will be formatted in a simple table layout with the student's name and deck name.
Real-World Reporting Examples
Example: Creating Intervention Groups
You review a comprehension deck and see:
|
Student |
Average |
|
Ava |
95% |
|
Ben |
82% |
|
Liam |
45% |
Instructional decisions may include:
- Ava: Enrichment activities
- Ben: Continue current instruction
- Liam: Targeted reteaching and intervention
Reports help you quickly identify next instructional steps.
Example: Progress Monitoring
A student's scores show:
- First: 50%
- Last: 85%
- Gems: 19/20
This data indicates growth over time and can contribute to instructional progress discussions. Always follow district and organizational requirements regarding formal progress reporting and documentation.
Accessing Reports from the Classes Tab
You can access Reports from the Classes Tab too.
The functionality is the same as the Reports tab described above.
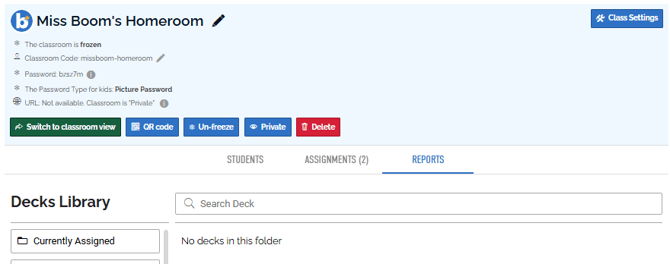
Navigating Individual Student Report
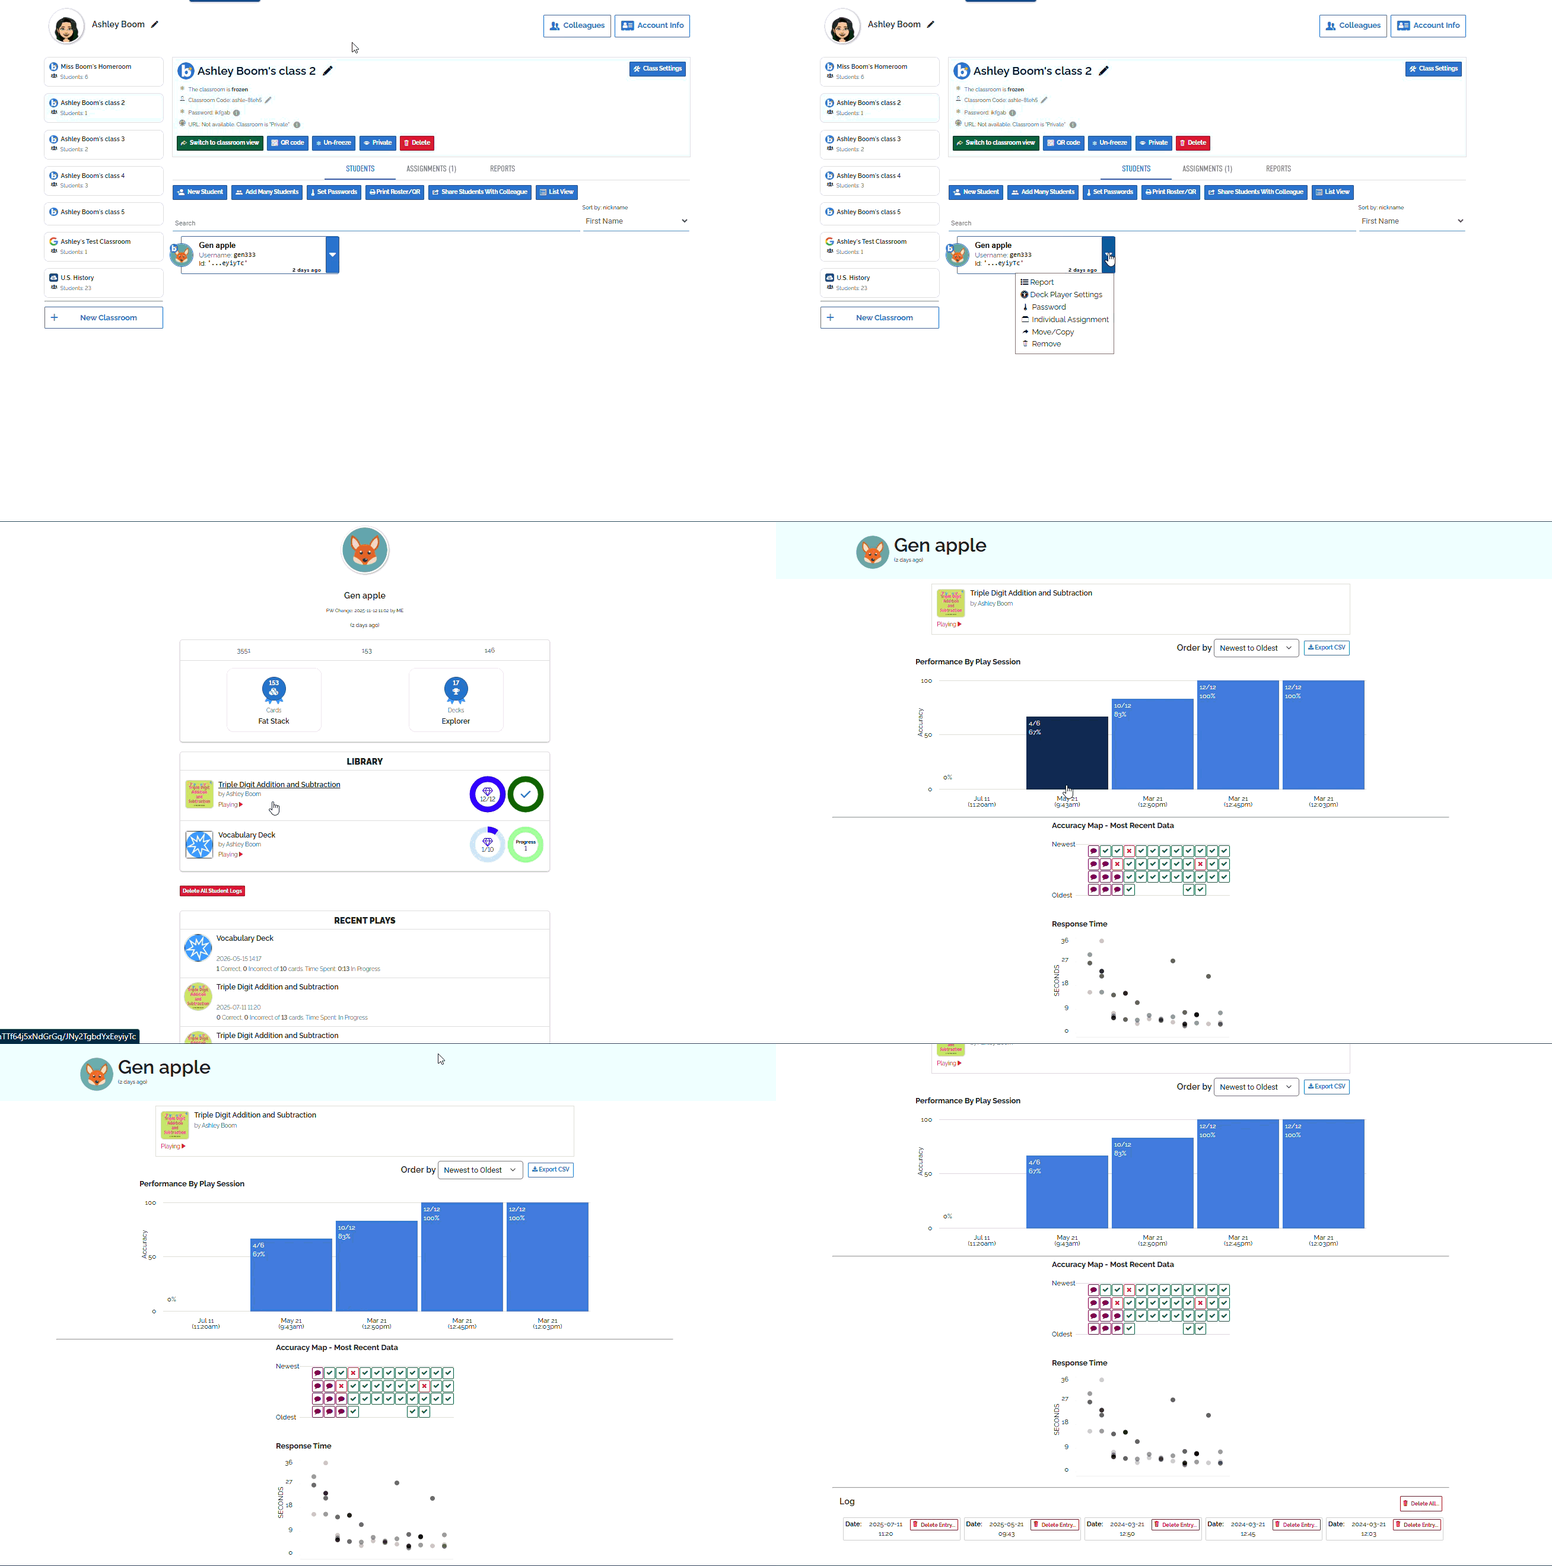
To focus on one student:
- Select a classroom.
- Select a student
- Select Report from the action menu
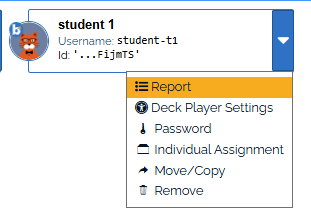
This view displays:
- Assigned decks
- Recent plays
- Progress indicators
- Earned rewards and achievements
You can use this page to navigate to deck detail reports described below.
Progress & Gems
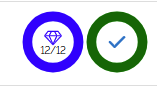
Progress (Green Circle)
Measures completion.
The checkmark appears when students have completed all assigned cards.
Gems (Blue Circle)
Measures mastery.
Students can continue practicing to earn additional gems and demonstrate stronger mastery.
Other Rewards
Student can also earn Coins and Pulses (Lightning Bolts). These are rewards and achievements that students earn for playing Boom Cards. You can learn more here: Coins, Gems, and Pulses
Deck Performance Report
The Deck Report shows how a student responded across all plays of a deck.
This report is particularly valuable when you need to determine:
- Exactly which skills need reteaching
- Which questions are consistently missed
- How performance has changed across recent sets
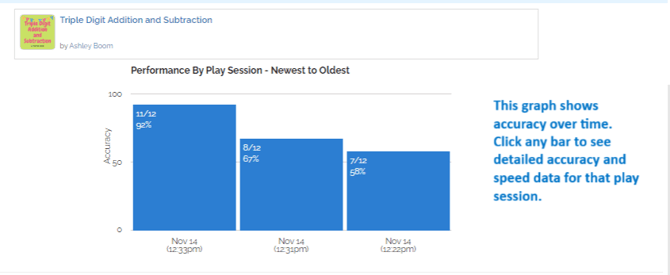
Performance by Play Session
This chart allows you to compare student performance over multiple play sessions.
Best Uses
- Tracking progress over time
- Measuring intervention effectiveness
- Evaluating growth trends
- Determining readiness for new content
Click on a Bar graph to see more information about that play or Print that play's card detail report
Accuracy
The Accuracy report displays correct and incorrect responses and allows educators to identify specific areas of difficulty.

Best Uses
- Planning reteaching
- Monitoring learning gains
- Comparing pre-intervention and post-intervention performance
If you see a purple speech bubble in your students' individual reports, that means you have a card to manually grade.
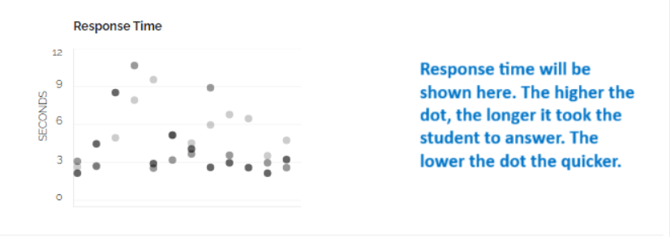
Response Time
Response Time shows how quickly students answer questions. The red line represents average response speed.
Best Uses
- Measuring fluency
- Identifying hesitation points
- Discovering skills that need additional practice
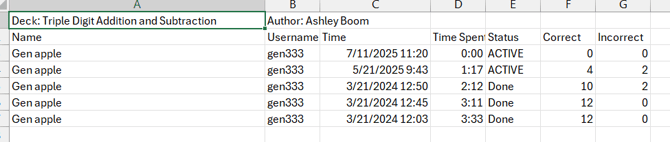
Exporting Reports from the Individual Student Report
Exports generate a downloadable CSV file that can be opened in Excel or Google Sheets for additional analysis and documentation.

From the Student Report View, you can Export:
- Student scores
- Time Spent
- Date and Time the play took place
Here is what that export will look like:
Deck Detail Report
The Deck Detail Report shows how a student responded to individual cards.
This report is particularly valuable when you need to determine:
- Exactly which skills need reteaching
- Which questions are consistently missed
Printing Reports from the Individual Student Report
You can print Card details for an individual play session using the "Show Details by Card" button.
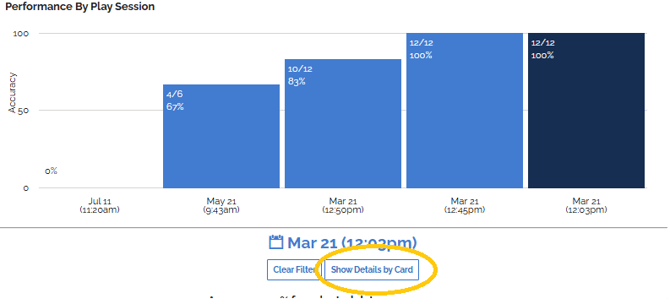
The Report will show:
- Scores
- Timestamps for the recent play
- Ink used on the card when applicable
You can choose to print this view. Select the print layouts displaying 1, 2, or 3 cards per row depending on your documentation needs.
Time-Saver Tip
Print individual reports before parent conferences, annual reviews, or team meetings so your data is organized and ready to discuss.
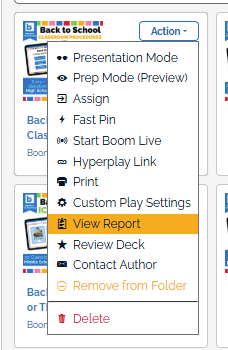
Navigating Deck Reports
Access your Deck Report from the Library tab, in the action menu of a deck.
Reports by Students
The default view of the Deck reports is Reports by Students.
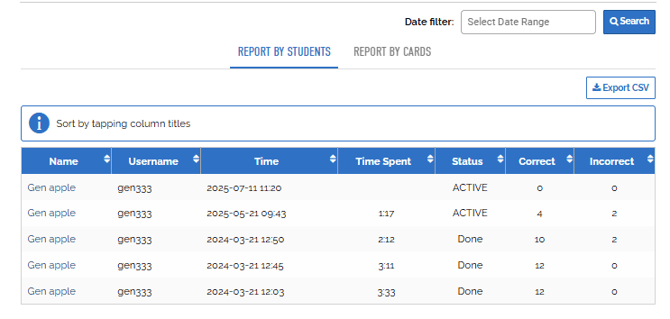
Here you can see
- Student account nickname and Username
- Date and time of play
- Time Spent
- Play status
- Student Score
Exporting Data
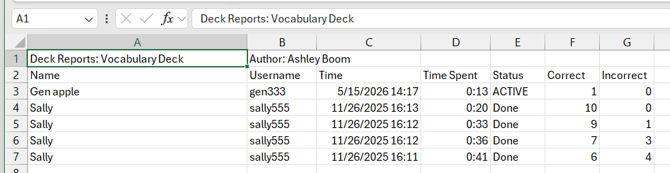
You can Export the data in the Report by students to a CSV file that can be opened using Excel or Google Sheets.
This report would contain Deck Name, Deck Author, Student account nickname, Student Username, date and time of play, Time Spent, Play status, Number correct, and number incorrect.
It will look something like this:
Time-Saver Tip
Print individual reports before parent conferences, annual reviews, or team meetings so your data is organized and ready to discuss.
Report by Card
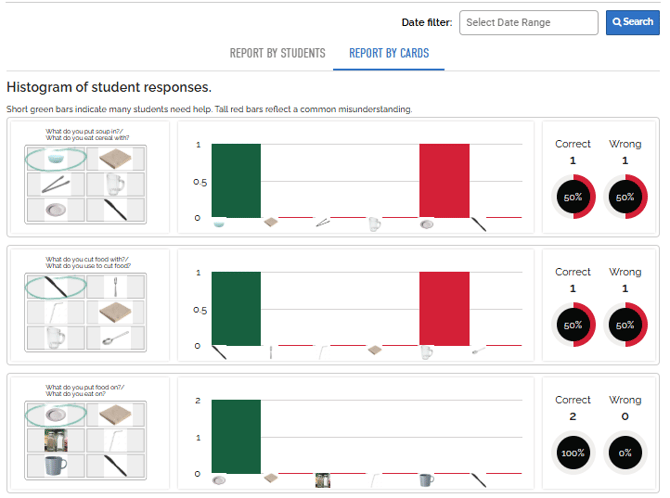
The view will allow you to see a histogram of all answers to each card.
This view can be filter by date range.
Keep an eye out for
⚠️Tall red bars are an indication a common misunderstanding
⚠️Short Green bars indicate many student need more support
Need More Help?
Our Boom Training Academy materials help educators learn the basics, find resources faster, and use Boom with confidence so that you can spend less time figuring out technology and more time with your students.
Interested? Access and interact with Courses here: Boom Training Academy
Are you a part of a managed Boom School account? Get private training! Ask your school or district administrator to schedule a complimentary training session with us.
If you have any further questions, please feel free to email us at help@boomlearning.com or call us at (833) WOW-BOOM. A real human will happily help you!